

Building Campaign Influence Reports for Pardot
This post is part 2 in our series on Customisable Campaign Influence. We recommend reading our first post, Understanding Campaign Influence, to ensure that you have the right strategy in place before building reports and dashboards.
Building Customisable Campaign Reports and Dashboards
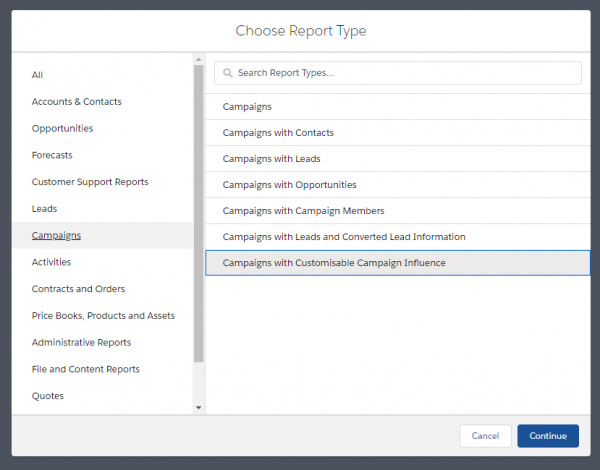
Go to Reports > New.
Choose Report Type > “Campaigns with Customisable Campaign Influence”.
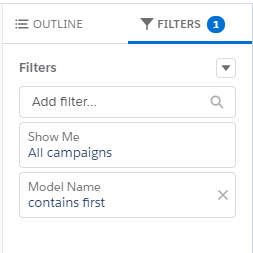
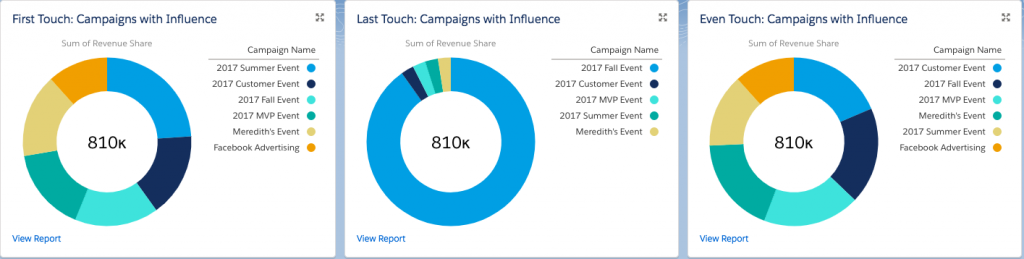
When report opens go to Filters and add Model Name. This can contain First, Last or Even depending on which report you are building.
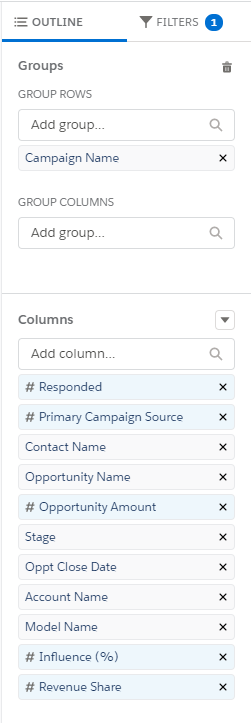
Add groups and columns data as shown below. *Please note revenue share may need removing and then re-adding for it to appear in the graph.
Click the chart properties cog and select Display As: Donut.
Change value to > “Sum of Revenue Share”.
Sliced by > “Campaign Name”.
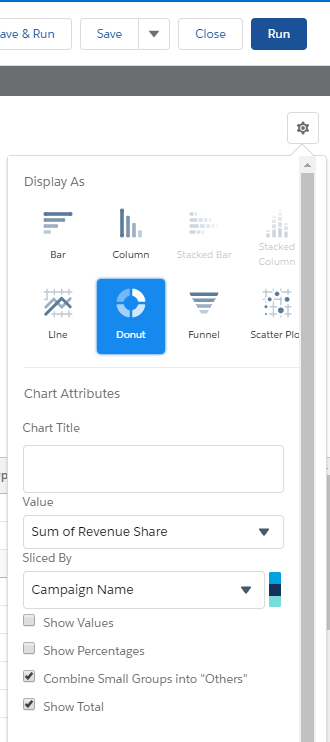
Click > “Save and Run”.
Once your report is created add it to a dashboard to easy comparison and data refresh.
Fill out the form below if you would like support to set up Campaign Influence reporting, to find out out more about our Marketing Strategy workshops or speak to a Destined Consultant.
Disclaimer: Before you can report on campaign influence you will need to set up Connected Campaigns. The use of connected campaigns is dependant on your Salesforce and Pardot subscription.
Speak to your Salesforce and Pardot administrator before making any system changes.